PURPOSE
The purpose of Talent Maps and gaps module is to determine and visualise the skill and head count gaps in the Business unit and the enterprise.
ENTERPRISE DEFINITION
Navigation:
Enterprise Definition >> Capabilities >> Talent Framework
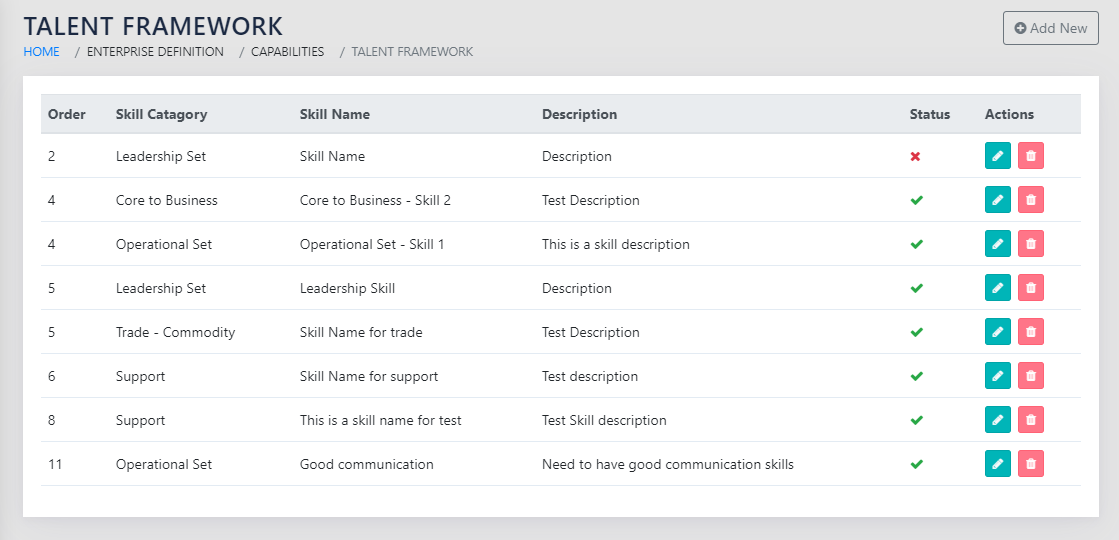
The Knowledge Framework contains a list of documented knowledge pieces in the organisation as shown in Figure 63: List of Talent Pieces in the Framework. The Talent pieces are categorised as Leadership Set, Operational Set, Core to Business, Trade-Commodity, Support and Peripheral.
The framework also warns the user when the granularity is too large, i.e. when the number of Talent items is more than 30.
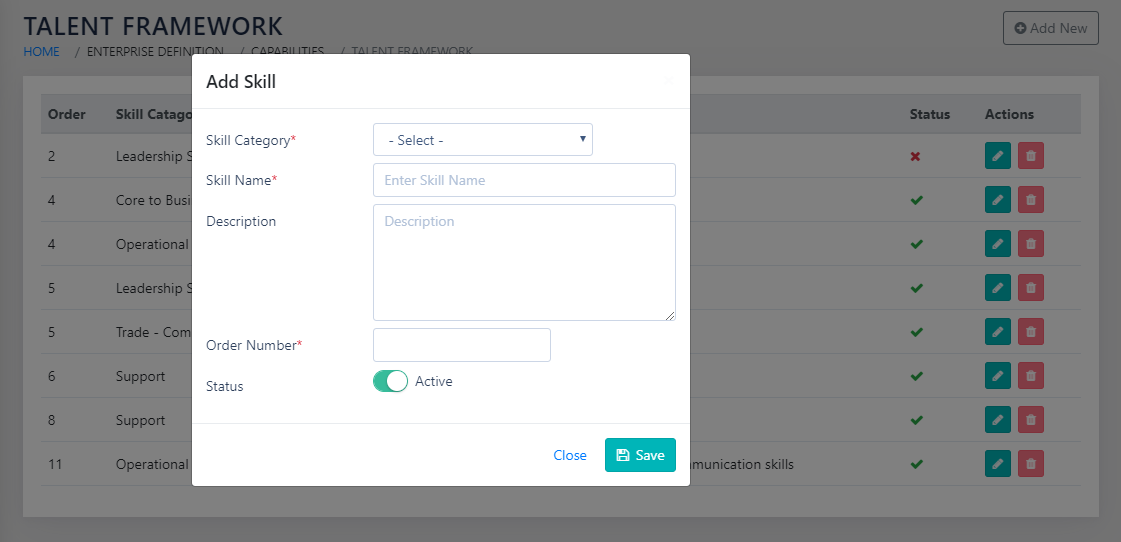
On clicking the icon or clicking the Add new button, the page as shown in Figure 64: Add a Skill/ Piece of Talent is presented to the user. The user selects the category from then dropdown and types in the name of the Talent Item. The Sort ID determines the order in which the item appears in the list.
CAPTURE
BUSINESS UNIT NEEDS
Navigation:
Data Capture >> Innovation Capital >> Talent Needs
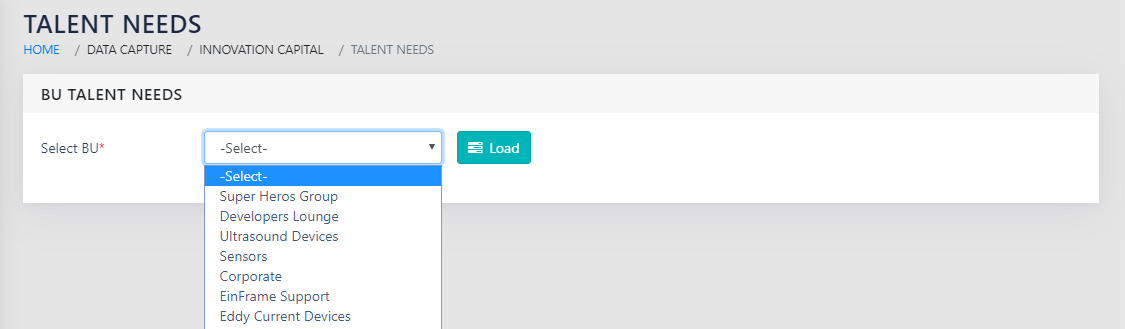
On landing on the page shown in Figure 65: Select BU to update Knowledge Status and Needs, you will get a dropdown for all active Business Units. You need to select the Business Unit for which the Knowledge needs require to be captured.
On selecting enterprise, the application rolls up the data for all active Business Units.
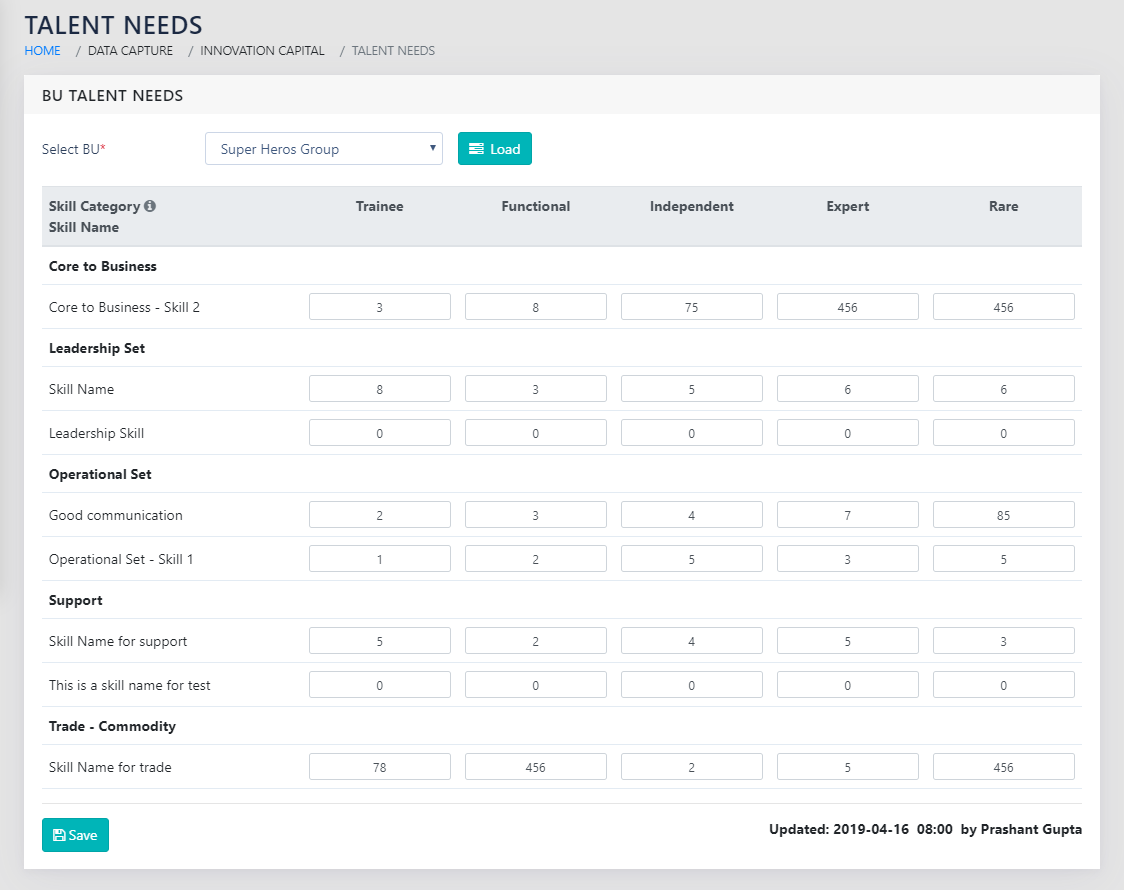
On clicking Load , you land on a page as shown in Figure 66: Update Talent Needs for the BU. There are five parts to consider in the page.
- The leftmost column is the list of Talent pieces in the system with categorisation.
- The next logical section, to the right of (a) is the the number of the individual pieces of Talent in the organisation required at each level. This can be from among the five levels, viz.
1-Trainee 2-Functional 3-Independent 4-Expert 5-Rare
A key aspect to note here is that the required numbers can be fractional. For example, if you need three employees with a certain skill and a certain level to work half a day at the skill, you would enter 1.5 as the Business Unit Requirement.
INDIVIDUAL EMPLOYEE RATINGS
Navigation:
Data Capture >> Innovation Capital >> Employee Talent Map
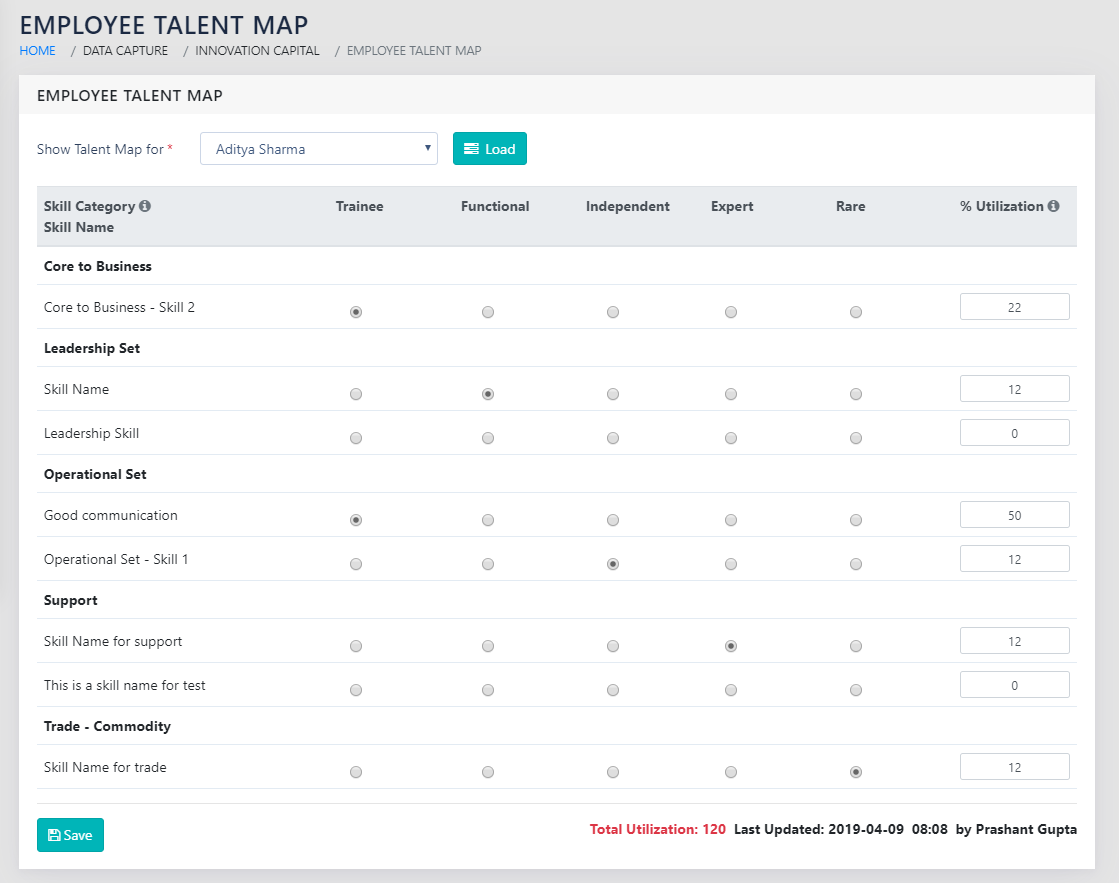
Every individual employee in the business unit rates themselves on each of the skills/talent pieces. They also specify the utilization of the skill in terms of a percentage fraction of the total working hours.
The total Utilization %age should be between 90% and 120%. The running Utilization counter turns RED if the total is outside these bounds.
The utilization against an individual Skill must not exceed 150%. The application will warn the user but allow saving the data. This is illustrated in Figure 67: Update Levels of Skills individually.
If the user has a certain skill above the trainee level, they should enter the utilization as a small non-zero percentage. The recommended value is 1%. The software warns the user if that is not the case.
The user can also see and edit the talent map of their direct reports.
REPORTS
Navigation:
Reports >> Talent Maps & Gaps
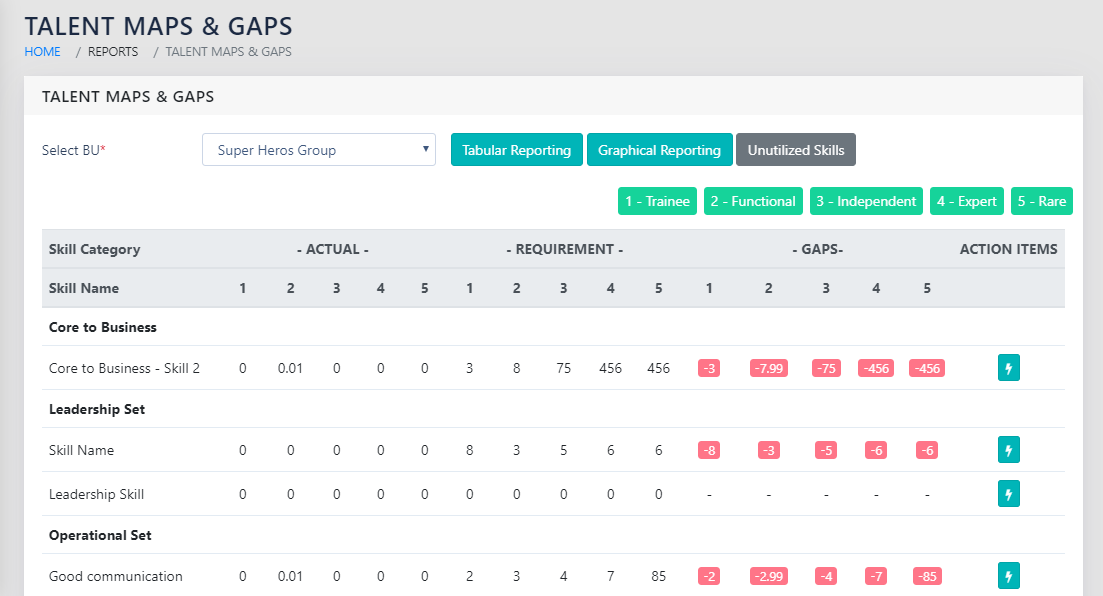
On landing on the page shown in Figure 68: BU Level and Enterprise level Talent Tabular Report, you can select either any of the active Business units or the Enterprise.
On selecting a particular Business Unit, you can choose to show either a tabular or a graphical report.
TABULAR REPORT
The tabular Report, as shown in Figure 68: BU Level and Enterprise level Talent Tabular Report, shows the data entered in a table at each level for each Knowledge item. This also calculates if there are gaps or excesses with respect to an individual knowledge item. The same is colour coded in Red for Deficit, and Green for excess.
On the right side of the page, you can choose to enter an action item related to the specific piece of Talent. This is enabled using the icon to add action items.
The consolidated report of all action items, including the ones entered here, can be seen in Action Items Reports.
GRAPHICAL REPORTS
On clicking the Graphical Reporting button, the user sees the page as shown in Figure 69: BU Level and Enterprise level Talent Graphical Report. The filled circles represent positive numbers whereas the blank circles represent negative numbers/gaps.
The Graphical report is smart enough to select the most appropriate scaling factor based on the spread of data in the report.
- All the bubbles are sized in proportion to the corresponding value’s ratio to the largest value in the report.
- The diameter of the bubble is proportional to the ratio of the values, if the ratio of the minimum and the maximum absolute value is less than 20. This is to highlight smaller differences. If the ratio of the minimum and maximum value is greater than 20, the area of the bubble is proportional to the values. This makes both the smallest and the largest values clearly visible on the same scale.
This is indicated on the left of the report, along with the legend for scaling.

SPECIAL FEATURES
The framework also warns the user when the granularity is too large, i.e. when the number of Knowledge items is more than 30.