PURPOSE
Smart forecasting represents the industry trends with respect to product KPIs and project the trends into the future to derive next generation KPI values, which, when aggregated, lead to next generation products.
ENTERPRISE DEFINITION
PRODUCT DOMAINS
Navigation:
Enterprise Definition >> External >> Product Domains
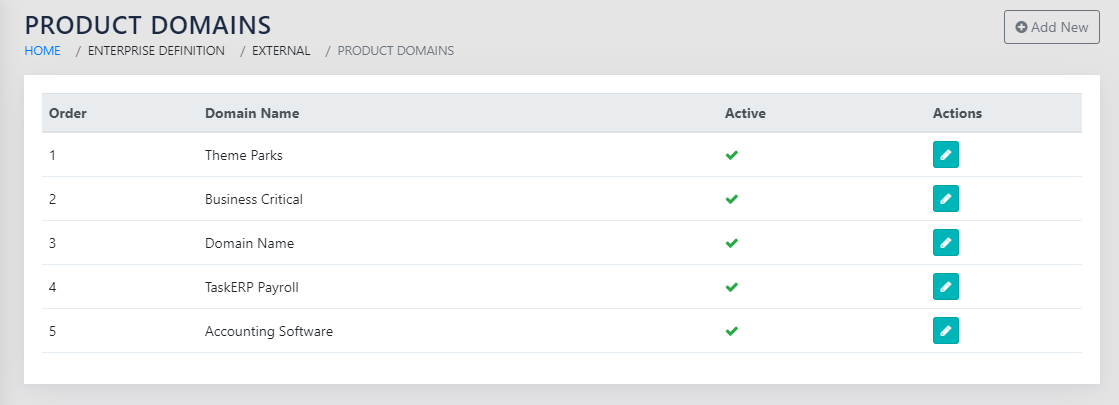
On navigating to the page shown in Figure 118: Product Domains, the user sees the list of all Product Domains that the BU operates in. They can click the icon or the Add New button to take them to the page shown in Figure 119: Add Product Domain Details.
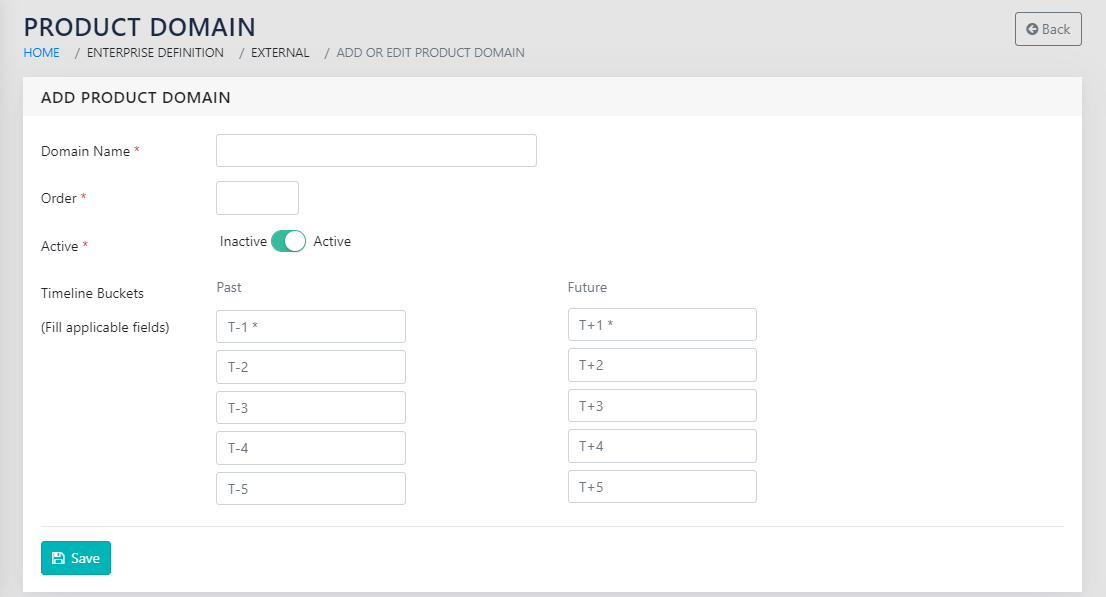
The page shown in Figure 119: Add Product Domain Details has the following details that need to be populated:
- The name of the Product Domain
- The order- that affects the sequence in which this is displayed
- Active – a checkbox to indicate whether the same is active or not
- Timeline buckets- There are five buckets each in the past and the future. These are typically related to the development horizon of the product. You should ideally be looking at 3 times the period a typical product generation lasts, or 3 times the development period of a typical product in the product domain.
PRODUCT KPI CATEGORIES
Navigation:
Enterprise Definition >> External >> Product KPI Categories
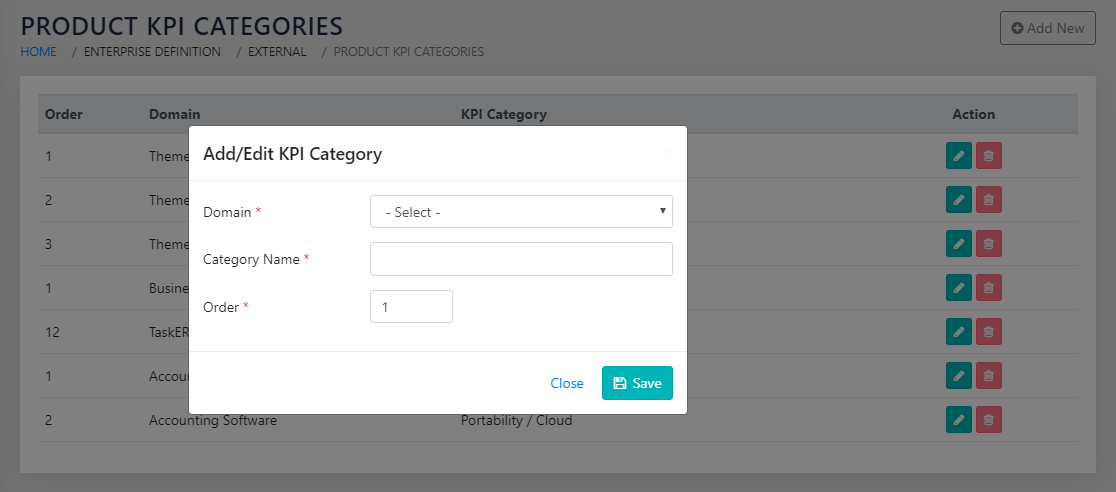
On navigating to the page shown in Figure 120: Product KPI Categories, a list of all categories for all KPIs for each product domain is displayed.
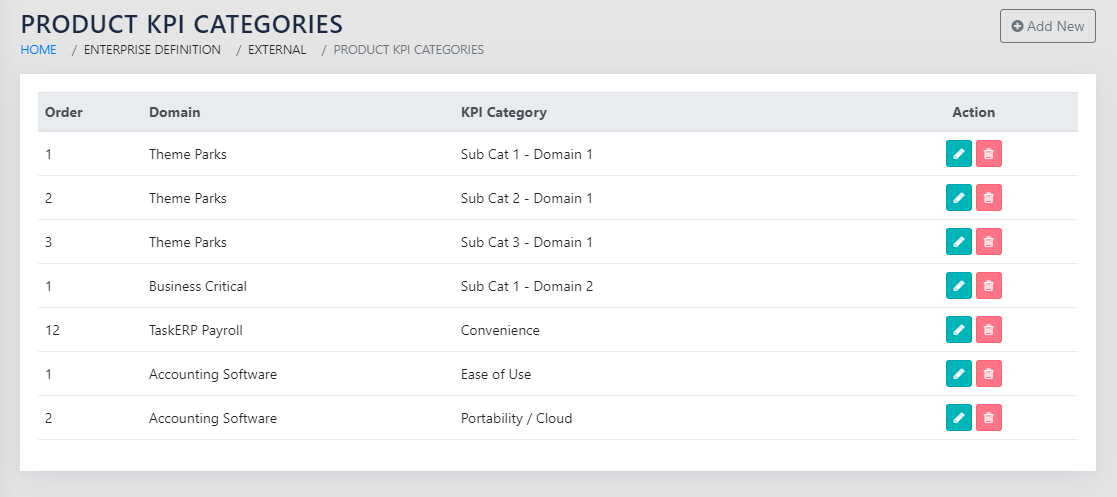
The user can click the icon or the Add New button to take them to the page shown Figure 121: Add Product KPI Categories for each Domain. The user is expected to select the product domain from the dropdown that is populated from the product domain master shown in Figure 118: Product Domains. The user is expected to type in the category name and select the sort order for display sequence of the categories.
PRODUCT KPI
Navigation:
Enterprise Definition >> External >> Product KPI
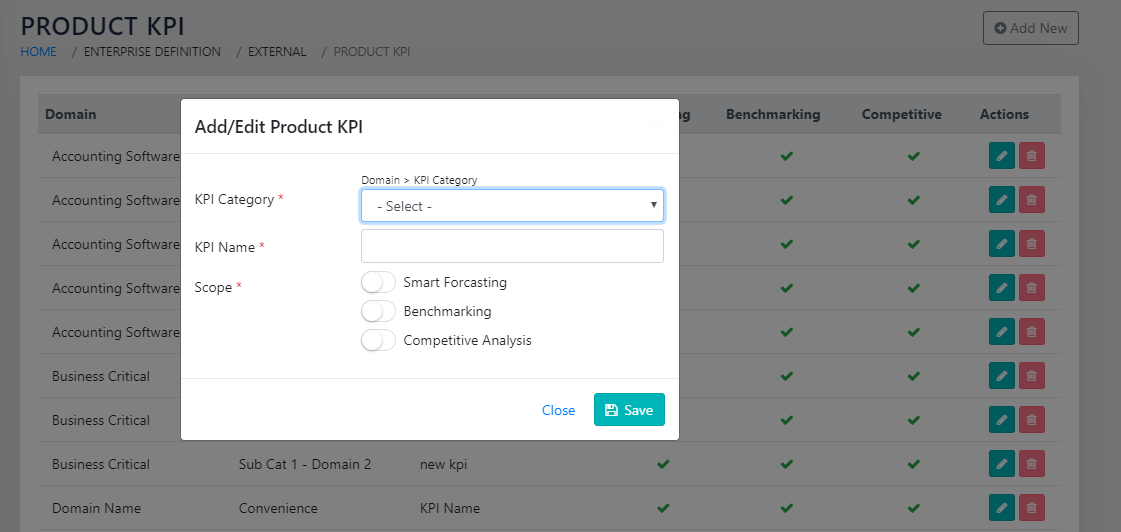
On navigating to the page shown in Figure 122: Product KPIs, by product domain and category, the user sees all product KPIs arranged by Domain and Product KPI Categories. The user can click the icon or the button to take them to the page shown in Figure 123: Add Product KPI and Category.
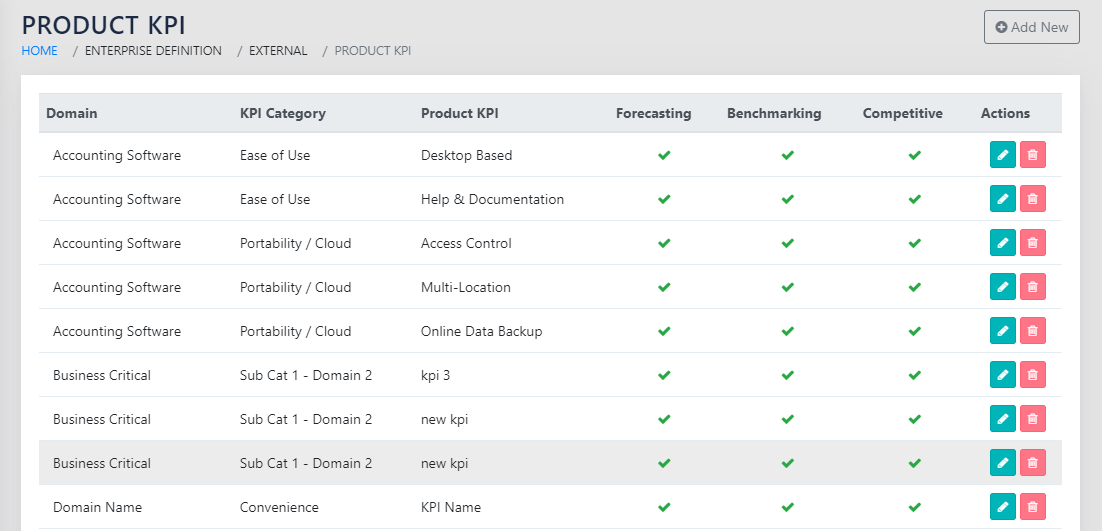
The user is expected to select the Product Doman > Category from the dropdown on the page and type in the KPI name. The user is expected to identify whether the KPI is a Forecasting KPI or a Benchmarking KPI, or both. This determines the KPIs that are available for capture in either module.
CAPTURE
Navigation:
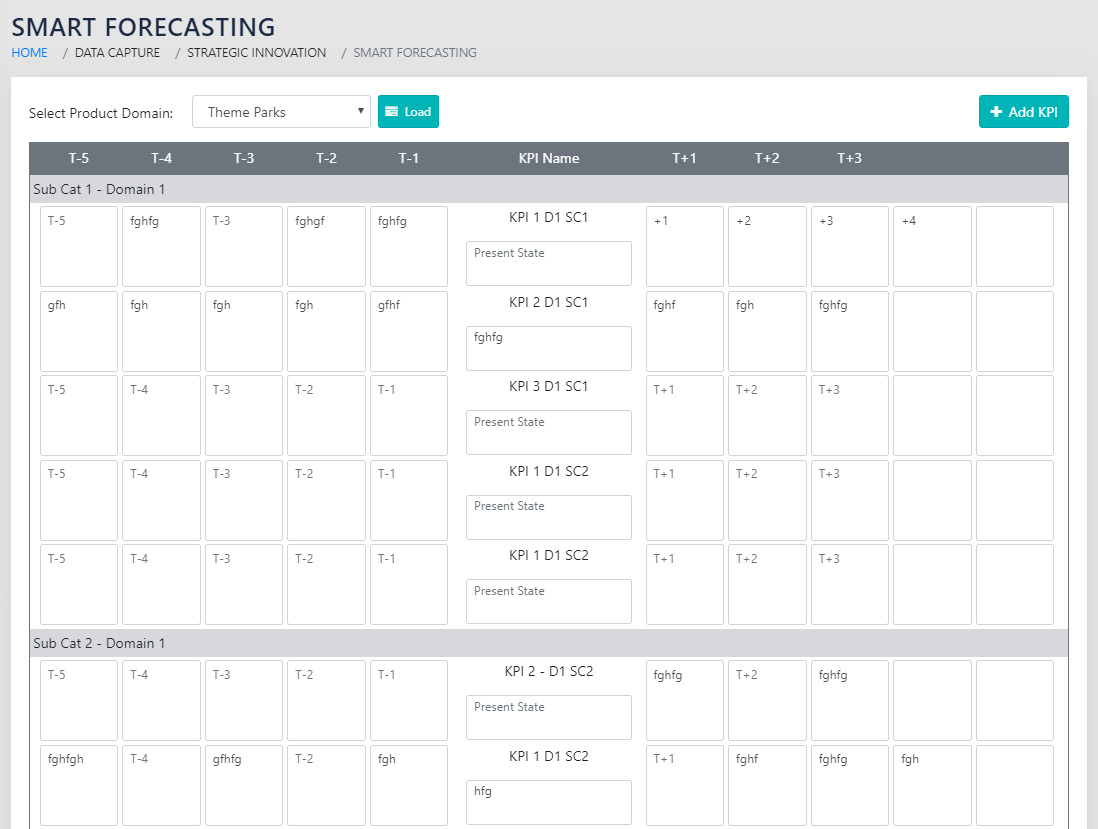
Data Capture >> Strategic Innovation >> Smart Forecasting
On navigating to the page shown in Figure 124: Select Product Domain for Smart Forecasting, the user can select the product domain from the dropdown and click on Load
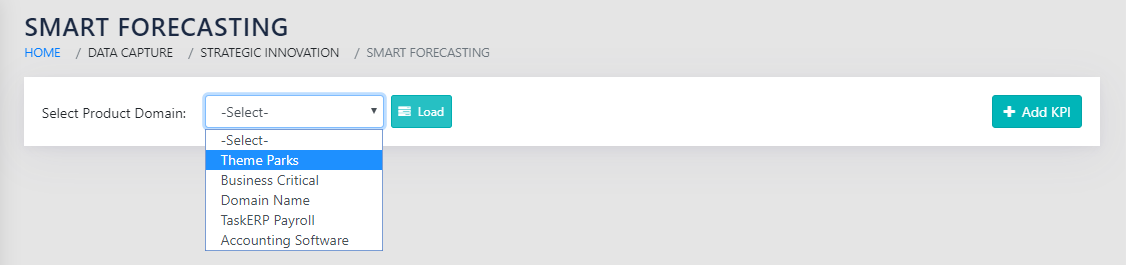
This brings up the page shown in Figure 125: Smart Forecasting.
For each of the product KPI in each category, the user can enter the state-of-the-art in the past timeline buckets, enter the current state in the text box in the centre and extrapolate the state-of-the-art for futire timeline buckets.
The icons to add and view action items are linked to each KPI for any specific data collection or validation tasks that the user may need to assign to themselves or others.